Data Labeling
The Data Labeling Tool provides a visual interface that allows users to categorize imported raw data. Tags such as arc or no-arc, and snoring or no-snoring can be applied to specific sections of the graph. This tool then segments the raw data based on labeling and creates datasets optimized for training machine learning models. We also provide a prelabeling tool to assist with labeling (optional)
Click the Data Labeling button under the Utilities set to open Data Labeling tool.
Data Import
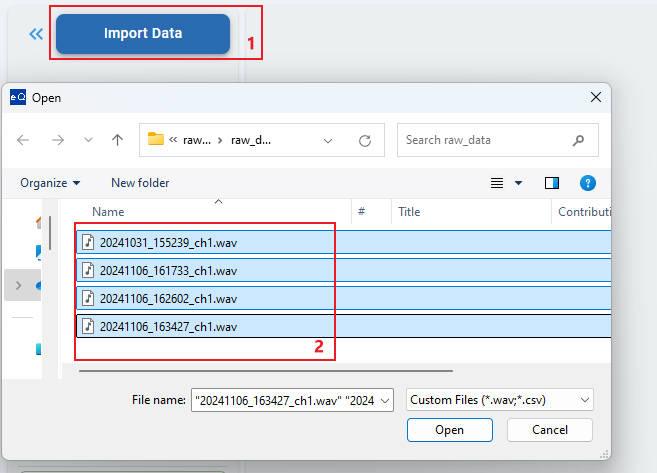
Raw data: Continuous current data is stored in time sequence. It is single-channel data, in CSV format (values separated by spaces) or float32 WAV format (single channel).
Rename Labels
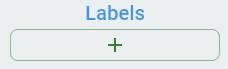
The label list contains labels for classification. The number of labels in the list corresponds to the number of classes. When you first access this tool, the label list is empty. Click the + button, create a class, and add it to the label list.
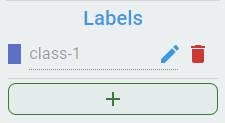
You can edit the alias of labels. This operation is optional and only intends to enhance label readability.
To edit the alias, first click the edit button:

Second, input the alias string, then click the check button to apply the rename.

To rename all labels one by one, repeat the steps above.

Labeling Operations
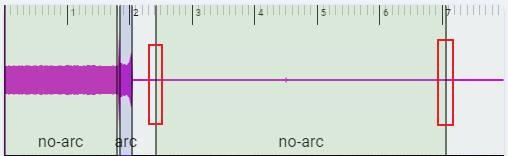
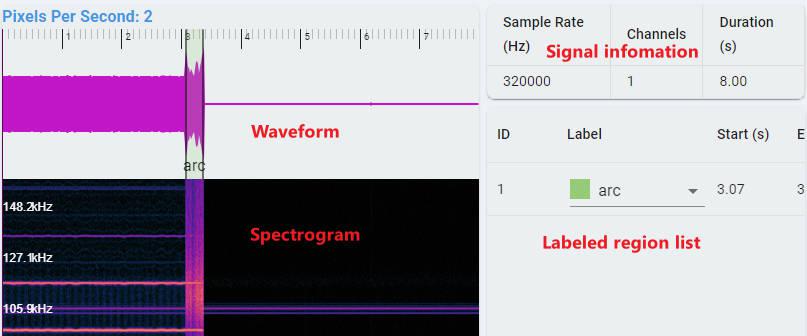 Waveform: Time series waveform of data.
Spectrogram: Time-frequency domain waveform of data, using STFT transform. The horizontal axis (abscissa) represents time, while the vertical axis (ordinate) represents frequency.
Labeled region list: Each region drawn on the time series waveform corresponds to a record here, including the classification label, start time, and end time.
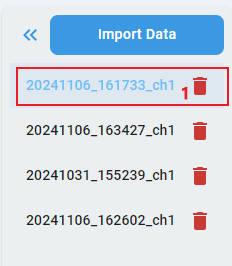
Step 1: Select a file to label.
Step 2: Draw a range on a waveform graph.
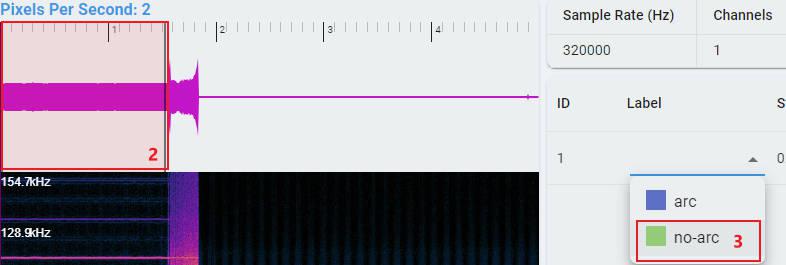
Step 3: Choose the label for the labeled region.
Repeat steps from 2 to 3 and label all the regions.
Repeat steps from 1 to 3 to label all data files.
Edit Labeled Result
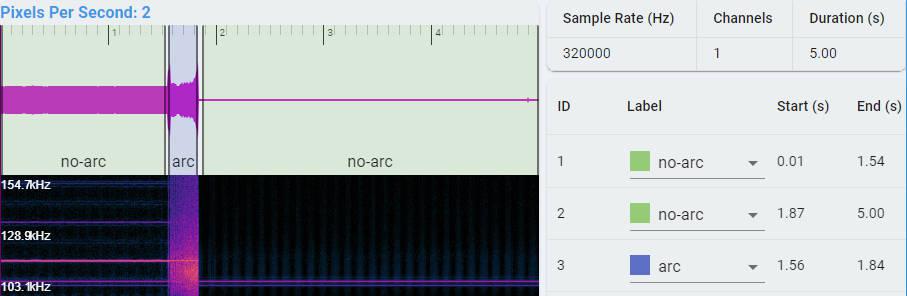
Edit region: You can modify the range of a region by dragging its boundaries.
You can change the label of a region by reselecting it.
Note: All ranges must be labeled before running the data generation.
Generate Dataset
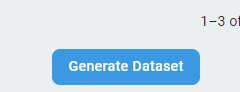
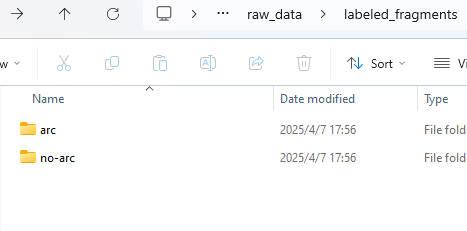
Click the Generate Dataset button. After processing, the data folders, segmented according to the labeling results, appear in a pop-up window.
Note: You can import the segmented data into Data Intelligence to analyze and obtain the recommended parameters such as window size, sample frequency. Next, use Data Operation to process the segmented continuous data according to the recommended parameters to create dataset that suitable for training.
Prelabeling (Optional)
We provide a prelabeling tool that can automatically perform prelabeling on continuous data. You can make adjustments based on the prelabeling results to reduce the labeling workload.
To use prelabeling:
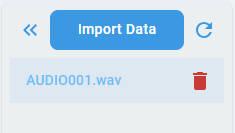
Import your continuous data files. Here we load an audio file containing snoring sounds to demonstrate the snoring detection prelabeling process.
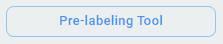
Click the
Pre-labeling Toolbutton. In the pop-up window, select a prelabeling algorithm (which currently only supports the snoring detection algorithm). Click theConfirmbutton and confirm your selection.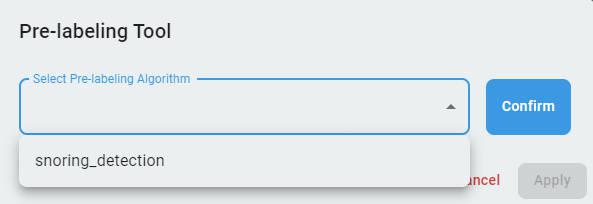
A warning dialog pops up, stating that this operation deletes all previous results. If you want to proceed, click the
Confirmbutton and enter the prelabeling process panel.
The label list is automatically changed to the preset of the algorithm.

Configure the parameters of the prelabeling algorithm. The number and type of parameters depend on the prelabeling algorithm selected. Different algorithms have different parameters or use the default values. Select the file list that needs prelabeling (must be files that have already been imported). Next, click the
Applybutton, and clickConfirmon the warning dialog that appears. Wait for a moment to complete the prelabeling process.

The prelabeling results appear in the labeled region list. Review all results and manually adjust the window or label categories, delete or add regions as needed. The subsequent process is the same as the standard manual labeling workflow.
