Data Intelligence
Data intelligence serves as a valuable tool for users that enables automatic and intelligent analysis of datasets for classification tasks. Anomaly detection can be regarded as binary classification. This section describes the process of dataset analysis. Also, it lists the steps to refine and recollect data for better performance and drawing insights from the analysis results.
Importance of Data Intelligence
Users usually import the time series dataset based on their own knowledge. However, due to some limitations, a comprehensive analysis of the data yields unsatisfactory results. For instance, the sample frequency can be higher than the corresponding application needs. Alternatively, the amount of training data in each class can be uneven for a classification task. To address these challenges, the data intelligence tool helps assess the balance of the dataset and identify the significance of each data channel/axis. The tool not only flags unbalanced datasets but also suggests the redundant channels for omission. Furthermore, the tool helps determine the optimal sampling frequency and window size, which enables you to refine the datasets for improved quality and analysis outcomes.
Data Settings
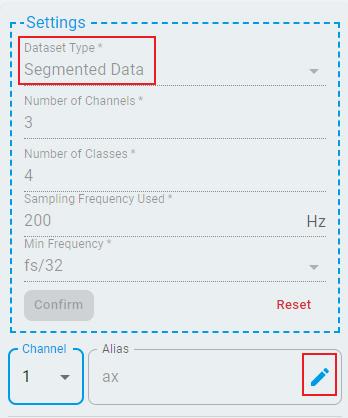
The first step is to configure the mandatory parameters for the imported data.
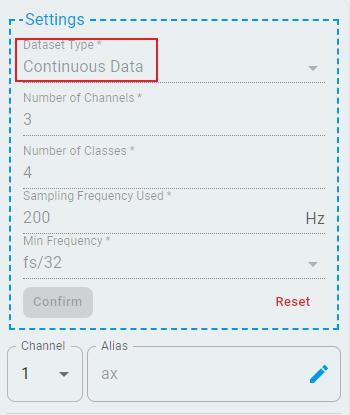
Enter the following information:
Dataset Type: Segmented or Continuous.
Number of Channels: How many channels for each data point.
Number of Classes: How many classes to be analyzed.
Sampling Frequency Used: The sampling frequency of the data.
Minimum Frequency: The lowest settable frequency division coefficient.
Once the number of channels is set, users can assign individual aliases to each channel, which aids in distinguishing between channels and understanding the analysis report. For example, the following figure shows the settings for importing the segmented fan state classification dataset for analysis.
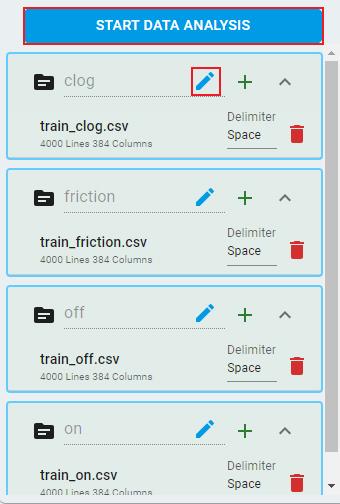
Next, click the + button beside each class to load files. The Delimiter, number of lines, and number of columns in the file are automatically recognized. Ensure that each file conforms to the settings specified: when the data is segmented, the number of columns must equal the window size multiplied by the number of channels. When the data is continuous, the number of columns must equal the number of channels. You can also modify the alias for each category to facilitate differentiation.
After completing these steps, click the START DATA ANALYSIS button and proceed with data analysis and generate a report.
Analysis Result
Once you initiate the analysis, the system processes the data for a few seconds and then display the results.
Here are the output items:
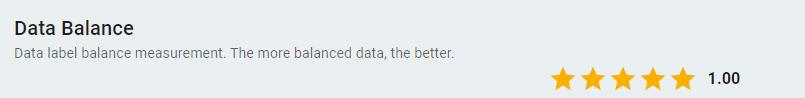
Data Balance
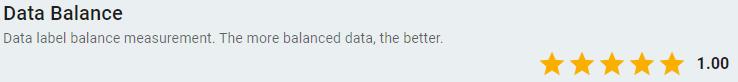
Rating the data with five stars indicates a perfectly balanced dataset, which is optimal for classification tasks.
Channel Correlation
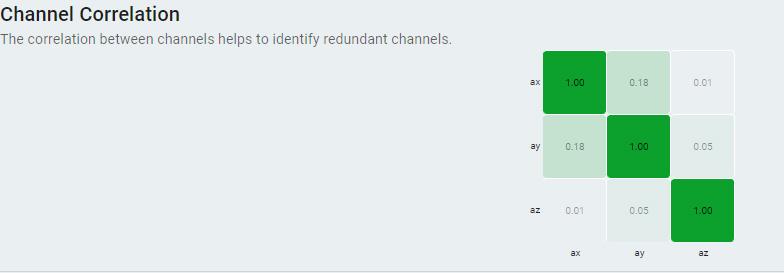
Applicable only for channels >= 2.
Displays a confusion matrix table that illustrates the correlation values between different channels.
The higher the absolute value, the higher the correlation between channels. The value closer to zero indicates that the channels are independent from each other. The information can be used to identify and potentially remove redundant channels. Removing redundant channels helps optimize the dataset for the training step.
Channel Importance
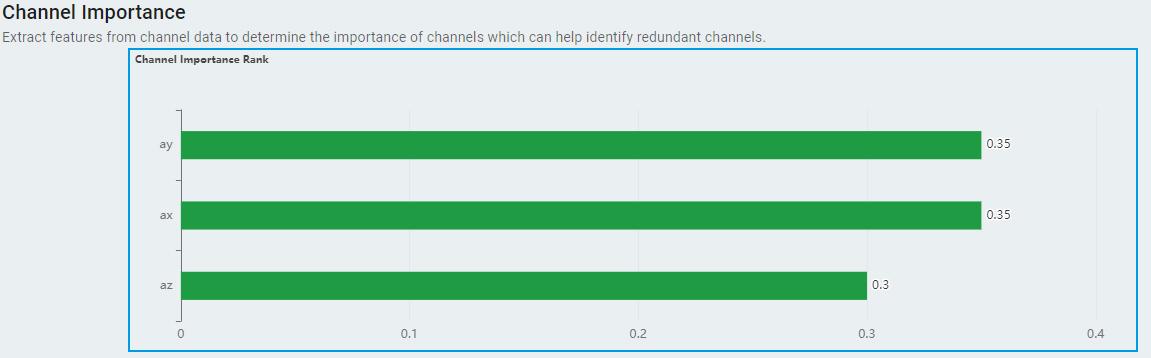
Only applicable for segmented dataset.
Only applicable for channels >= 2.
Displays the importance scores for each channel in ranking bars, the higher the better.
Best Sampling Params
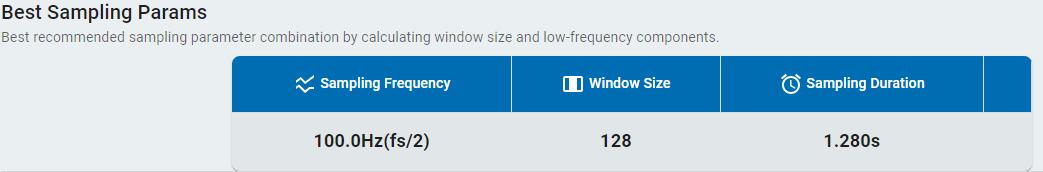
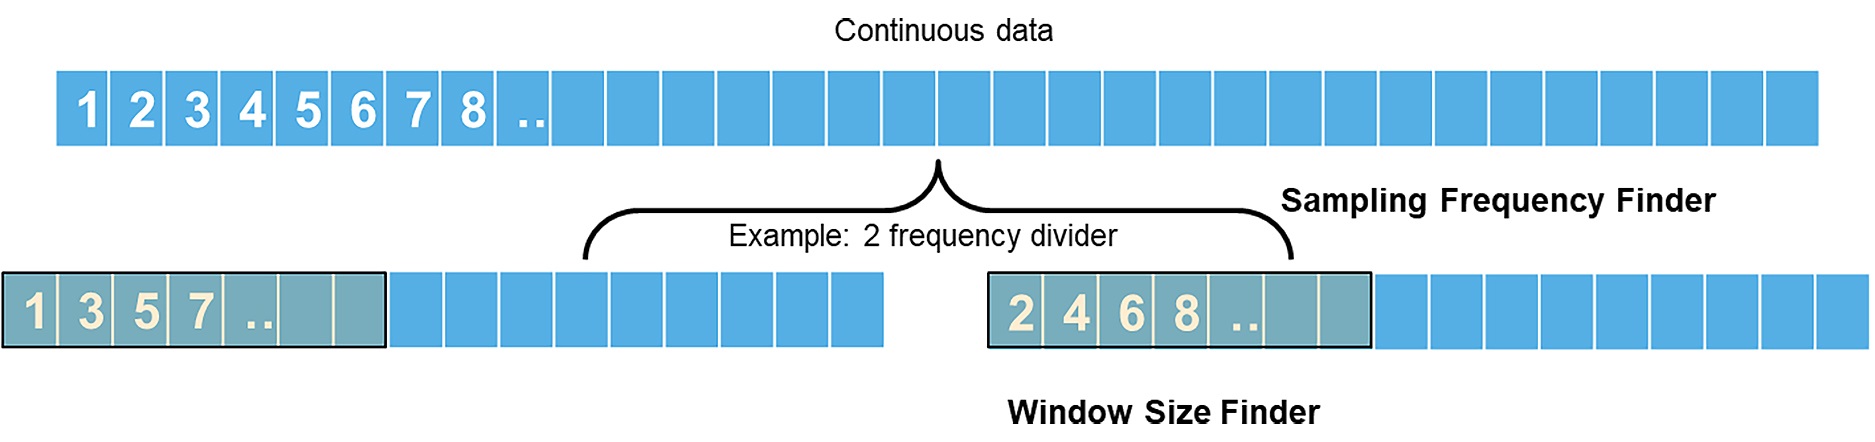
Sampling Frequency: Outputs a recommended division frequency of the original sampling frequency. This recommendation is designed to help remove potential high-frequency noise components from the data. By reducing the frequency in this manner, users can save resources and power while still maintaining the essential information.
Window Size: Outputs a recommended window size. It keeps unchanged for segmented data and is only valid for continuous data.
Sampling Duration The sampling time for a single segmented sample data.
Distinction Score: Applicable only for continuous data. Outputs the data differentiation score for continuous data under the optimal segmentation window size and sampling frequency.
Continuous Data
Here, we provide an example of a continuous dataset. This dataset represents three-axis acceleration measurements at different state of a fan:
The dataset consists of three channels, which are three acceleration axes.
Each data file represents a fan state.
The sampling frequency is 200 Hz. Each data file contains 720,001 lines. Each line has three channels.
Follow the steps above for data settings and load data for smart analysis. The analysis output shows:
Data balanced with five stars.
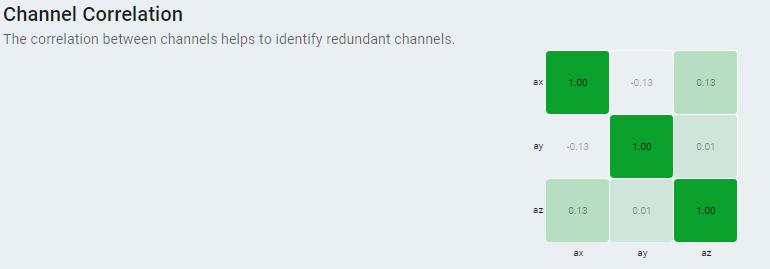
The correlation between channels is low, indicating that there are no redundant channels.
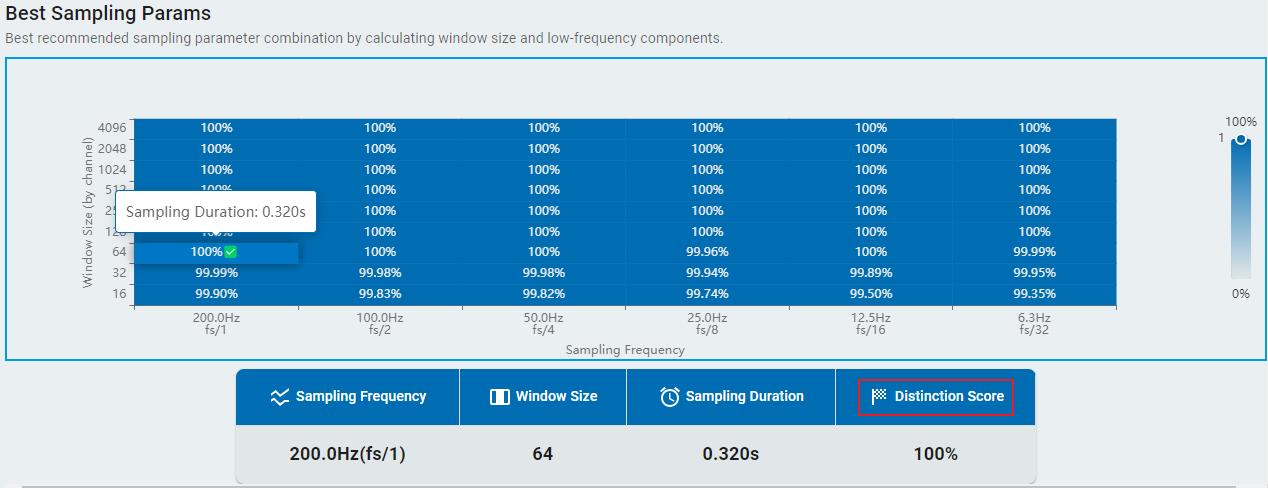
In the windows size and sampling frequency matrix, the combination of a frequency of fs/1 and a window size of 64 is the most recommended.
Users can import continuous data into Data Operation. Use generate samples and try the recommended sampling parameters to generate sample data sets for machine learning projects. If the recommended sampling frequency is not 1/1, the data is down sampled according to the division frequency and the recommended window size. For example, if you get 1/2 division frequency after smart analysis, then the dataset is down sampled and saved as below.
Finally, users can choose the quality and click the Save PDF button to save the analysis report PDF in the local system.

Conclusion
The data intelligence tool automatically generates reports on the quality of datasets and provides feedback to users without direct engineering support from NXP. The analyzed features include Data Balance, Channel Correlation, Channel Importance, and Best Sampling Params. These features empower users to make informed decisions regarding data recollection or reformatting, ensuring that their datasets are in an optimal state for subsequent processing.