Time Series Concept
There are many vision and voice applications with AI/ML algorithms for automotive, industrial, and consumer markets, which are based on image and voice data. Except for these data, there are also plenty of sensor endpoints running on edge devices that can produce different time series data.
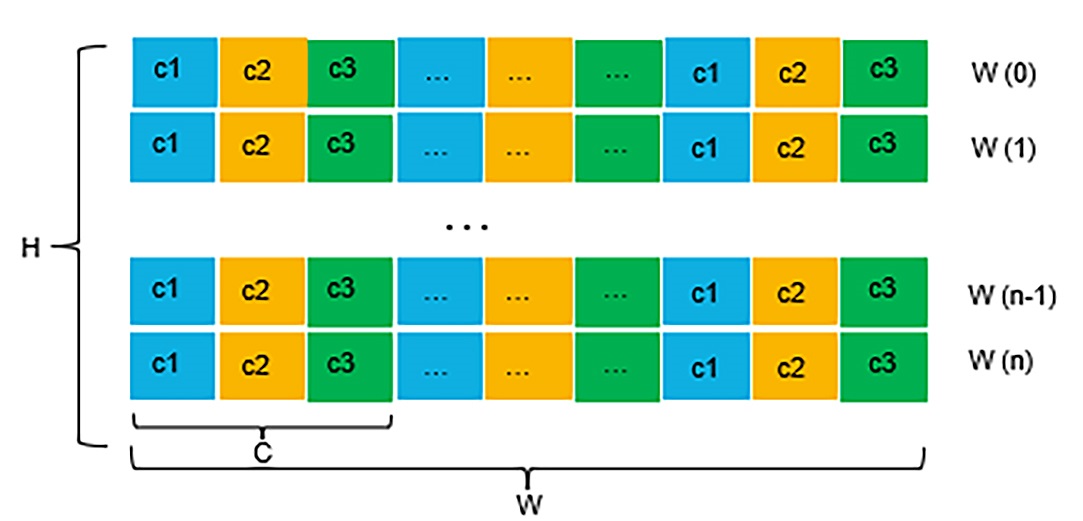
Below is an example of time series data produced by a three-axis (x, y, z) accelerometer sensor. The time series data has the following layout in memory.
Typically, signal processing is applied to the time series data to extract features first. Then, it is combined with AI/ML models to build the complete algorithm pipeline. Auto machine-learning technology is used to optimize the search space and find the best-fit models list. Time-series AI/ML technology can enable different use cases in automotive, industrial, consumer, healthcare, agriculture, and other sectors.
Time Series AI/ML Algorithms
Typically, there are four types of algorithms that are applied to time series data:
Anomaly detection
n-Class Classification
1-Class Classification
Regression
Here is the category illustration of these algorithms in the complete machine learning landscape:
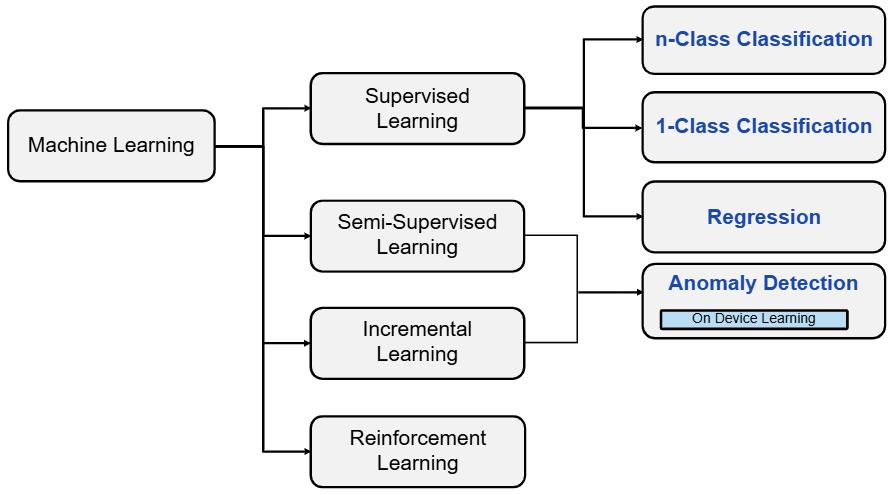
Both n-class classification and regression algorithms are supervised learning methods. The time series data must be labeled with predefined classes for n-class classification or with ground truth target values for regression during training. The prediction of the algorithm for one sample is the probability of each class for classification or a continuous value for regression.
1-class classification is a special case of n-class classification, where data observed during training is from a single positive class. The goal is to learn a representation and/or a classifier that enables recognition of positively labeled queries during inference. The prediction is a binary decision: belongs to the class or not.
Anomaly detection uses semi-supervised learning. The time series data must be labeled as normal or anomaly before training. Only the normal data is used for model training. The anomaly data is used for validation. The prediction of the algorithm is the probability of being normal for one sample.
Anomaly detection can also be configured to support incremental learning or not. Therefore, if incremental learning is enabled during training, it can support on-device learning during deployment. On-device learning can introduce additional flash and RAM requirements for deployment on edge devices.
Anomaly Detection
Illustration of Anomaly Detection
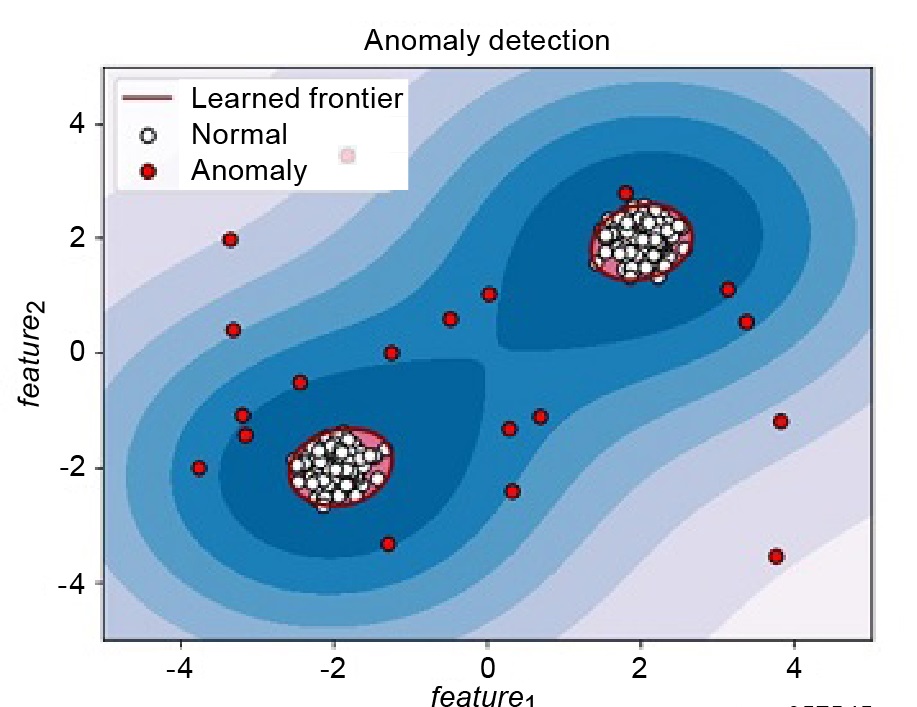
Anomaly data stands out from normal data points. To build an anomaly detection algorithm, both normal and anomaly datasets must be prepared in advance. Anomaly detection is different from two-class classification, which is based on supervised learning.
When to Use Anomaly Detection?
Normal samples can be clearly identified and collected; however, anomaly samples can only be identified and collected in limited cases. Here are some examples of anomaly detection use cases:
Smart motor health monitoring to predict whether the motor is healthy or unhealthy (various cases).
Arc fault detection to predict arc faults.
Washing machine load imbalance detection to predict load imbalance in washing machines.
n-Class Classification
Illustration of n-Class Classification
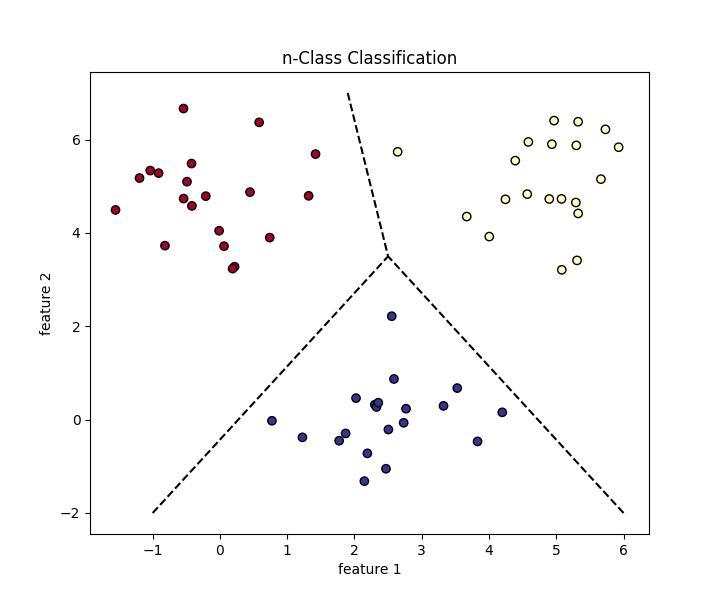
Classification is the task of classifying samples into different categories, with a minimum of two categories. To build a classification algorithm, a labeled dataset with predefined categories must be prepared in advance.
When to Use n-Class Classification?
Problems like vehicle type classification and animal classification have labels that are discrete and independent of each other.
The data samples of each category can be clearly identified and collected, and the dataset numbers for each category must be balanced. Here are some examples of classification use cases:
Human activity classification to predict different human activities like walking, going downstairs, or going upstairs using accelerometer and gyroscope sensing data.
Fan state classification to predict different fan running states like on, off, clogged, and friction using accelerometer sensing data.
1-Class Classification
Illustration of 1-Class Classification
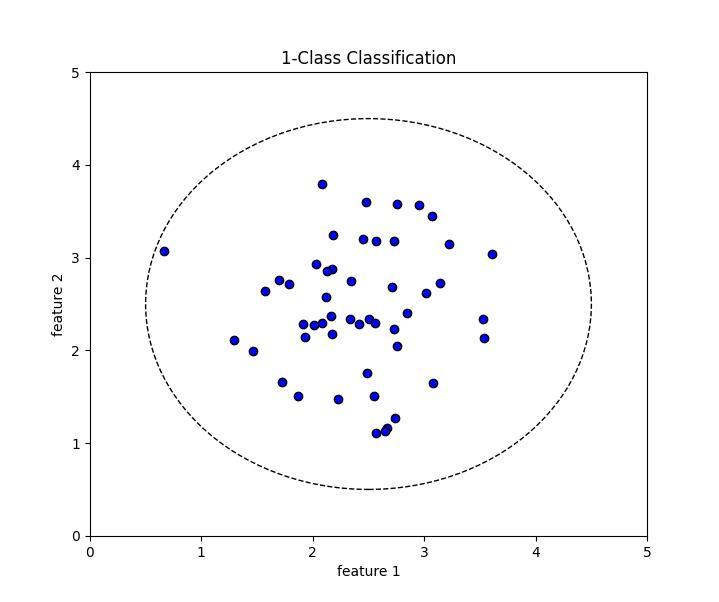
1-Class Classification is a specialized machine learning technique where the model is trained on data from a single positive class. Unlike traditional multi-class classification, the goal is to learn the characteristics of the “normal” or “target” class and identify whether new, unseen data points belong to this class or not.
When to Use 1-Class Classification?
Limited Anomaly Data
When anomalous or negative class samples are rare or difficult to collect.Novelty Detection
When the goal is to identify new or unseen data points that differ from the known “normal” class.Outlier Detection
Identifying potential outliers or unusual patterns in data that deviate from the learned normal behavior.
Regression
Illustration of Regression
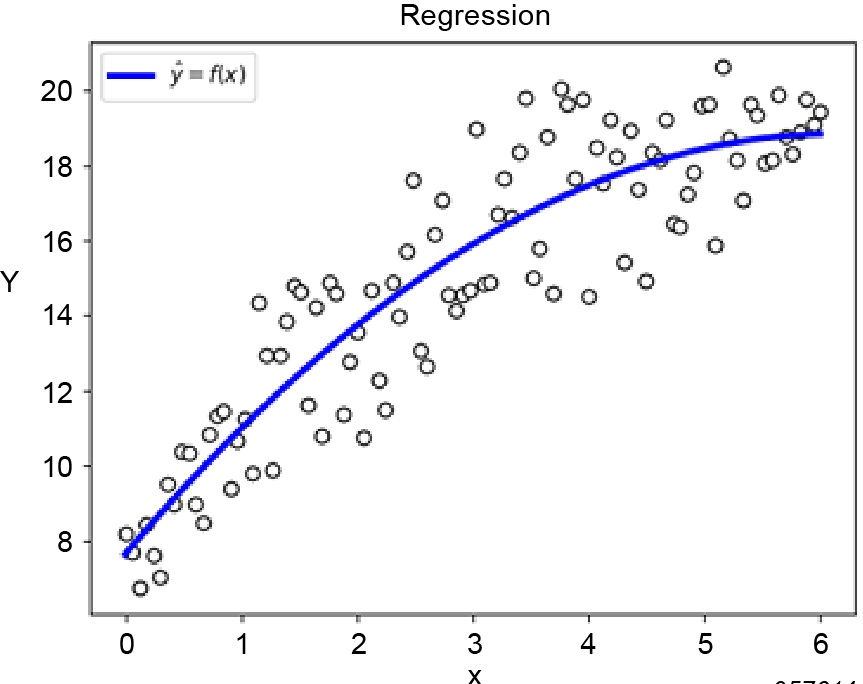
Regression models the relationship between one or more independent variables (predictors) and a dependent variable (the target). This model can then be used for prediction, understanding relationships, and making data-driven decisions.
When to Use Regression?
Continuous Output
Problems like predicting house prices, stock prices, temperature, or distance, which cannot be addressed using classification.Precision
It provides continuous output within a range, offering finer-grained results (compared to classification).Interpretability
Regression helps explain the relationships between independent and dependent variables, offering insights for decision-making.
Here are some examples of regression use cases:
Electric motor temperature prediction to predict permanent magnet tooth temperature and motor torque using several sensing data points in a PMSM deployed bench.
Air blower clog ratio prediction to predict the clogged ratio from 0% to 100% using motor torque data.
Washing machine load prediction to predict washing machine load from 0g to 500g in 50g intervals.
Time Series Applications
Time series data exists especially for different sensors. This data provides an opportunity to build value-added features with AI/ML technology that can solve real problems. It can be difficult to provide a satisfactory solution with high reliability using traditional algorithms. Using AI/ML algorithms is a reliable direction. The diagram below gives an overall picture of the algorithm building flow from different sensor data to many interesting applications.
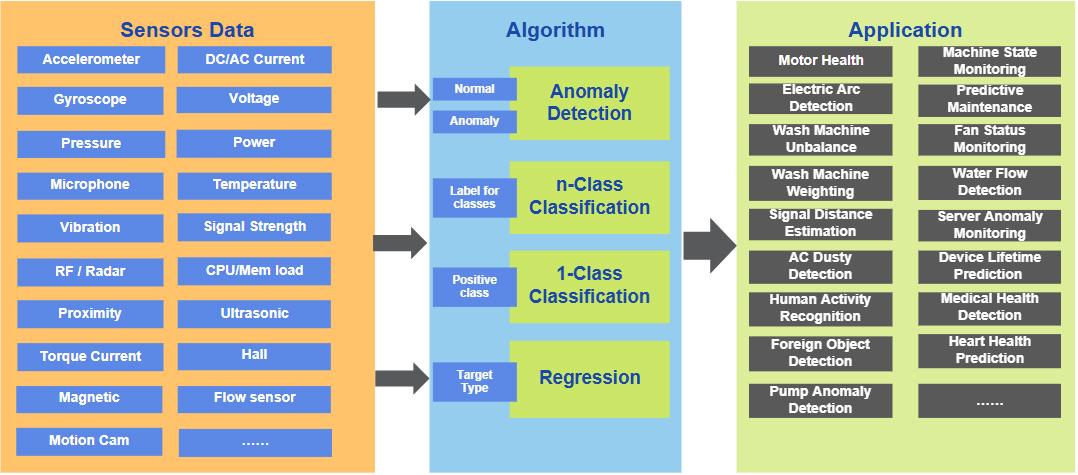
This diagram lists sensors like accelerometer, gyroscope, pressure, temperature, proximity, current, and voltage. According to the application definition and system design, you can choose the best-fit algorithm type like anomaly detection, n-class classification, 1-class classification, and regression. Sometimes, you can use multiple sensor inputs with multiple algorithm pipelines to implement concrete applications.
This diagram illustrates some known sensors and applications. You can freely define features in your product design. The eIQ Time Series Studio IDE helps you build your algorithms and demos for validation and assessment. In-depth time series AI/ML knowledge and complex coding work are not required.