Emulation
Why is emulation necessary?
Emulation is an important and innovative feature that helps to:
Verify the accuracy and usability of the C/C++ model code at deployment by using the same C/C++ model code as the actual deployment.
Verify and test real data and check whether the algorithm is overfitting or whether the accuracy meets expectations.
Verify the capability of the on-device learning function of the anomaly detection model on the PC in advance.
Benchmark each algorithm model to rank out the best model.
Benchmark the accuracy statistics of a specific model across all classes for further optimization.
Identify deployment library bugs that may occur during the training-to-library generation process.
Verify the real-time prediction capabilities of the model before deployment.
Quickly predict unlabeled offline file data and online serial port data.
What functions does the emulation support?
Emulation supports the following main functions.
Emulation of model benchmark for labeled data and model prediction for unlabeled data.
Anomaly detection algorithm on normal and anomaly datasets with real test accuracy.
Emulation test of the on-device learning function of the anomaly detection algorithm by importing offline learning files or online serial port learning data.
Classification algorithm on different class datasets with real test accuracy.
Regression algorithm on the specified target datasets with real test results.
Parallel emulation of multiple algorithm models selected by the user.
Offline continuous raw data and segmented data files import.
Online serial port data imported by connecting to the target board.
Visualization of test results and status for all emulation models.
Graphical display of test results for each test file, test results for each label/target, and overall test results.
Save and export test results in CSV file format.
Emulation report generation for each successfully emulated algorithm model.
Retry function for models that fail emulated due to network reasons.
Emulation prediction of unlabeled offline file data and online serial port data, and prediction result file generation.
Command-line execution of emulation and outputs the decision values, labels, and benchmark details.
How to perform an emulation?
Switch to the Emulation tab after training is completed, stopped or paused, and part of trained models output.
Depending on whether the test data is labeled, emulation enters two modes: model benchmark and model prediction.
Function layout of emulation model benchmark
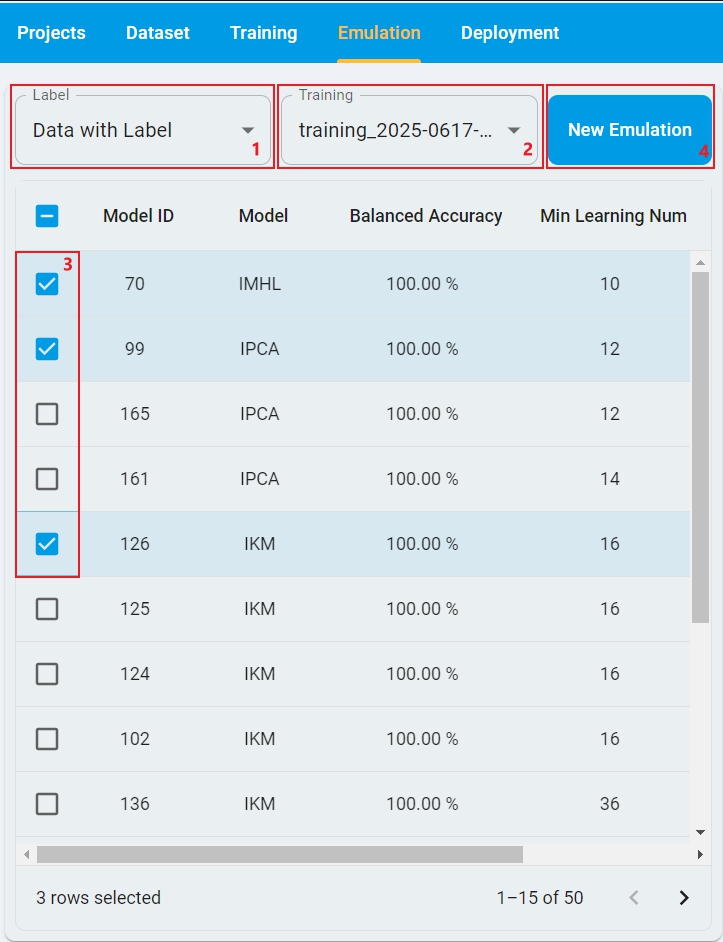
Here is the layout of Emulation Model Benchmark for Data with Label, with the steps highlighted on how to run it.
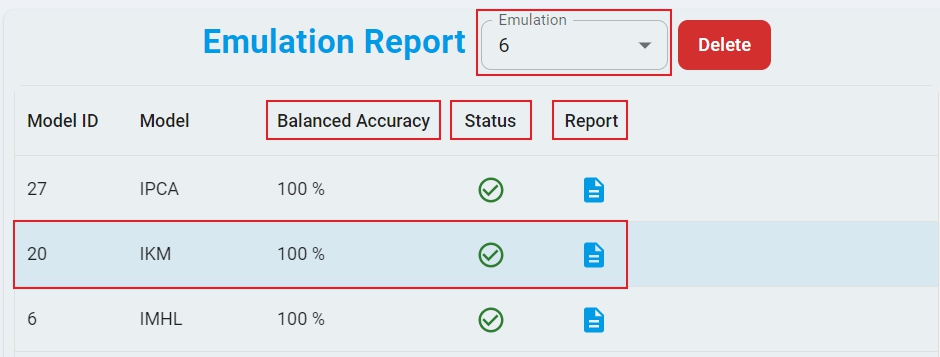
Here is the layout of the Emulation Report with the key sections highlighted.
Emulation Model Benchmark Process
Emulation requires public network support because the emulation executable image must be dynamically generated from the cloud server. Perform the following main actions.
Step-1: Select
Labelstatus based on whether the test dataset is labeled. Here isData with Label.Step-2: Select the
Trainingrecord from the drop-down list, which generated a lot of models by the training session.Step-3: Select the checkbox for one or more models to be tested.
Step-4: Click
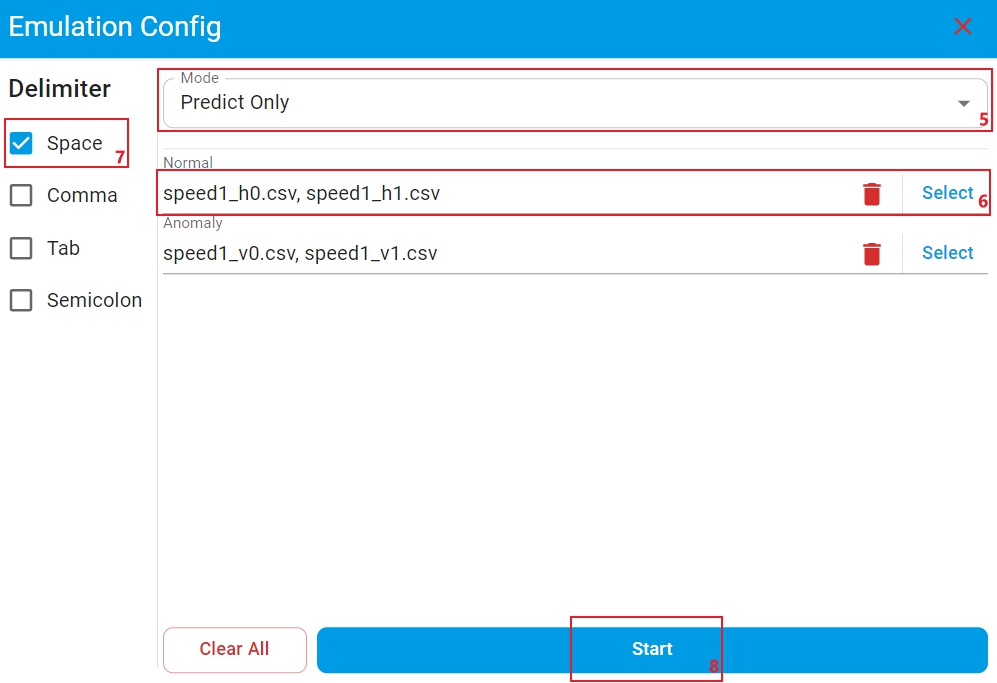
New Emulationand open the test data files selection window.Step-5: Select emulation
Modefor anomaly detection models with on-device learning enabled. There are three modes:Predict Only,Learn with Knowledge, andLearn without Knowledge. For other cases, no selection is required and the default isPredict Only.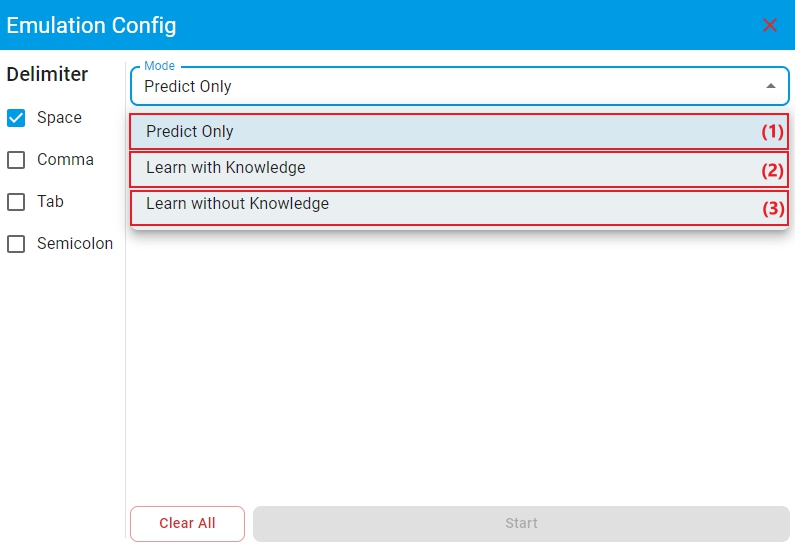
(1) Mode
Predict Only: The algorithm library makes model predictions on the test files.(2) Mode
Learn with Knowledge: The algorithm library retains the trained model parameters to perform incremental learning on the learning files, and then makes model predictions on the test files based on the newly learned model.(3) Mode
Learn without Knowledge: The algorithm library retrains the model on the learning files, and then makes model predictions on the test files based on the newly trained model. In this case, ensure that the data volume of the selected learning file reachesMin Learning Num, otherwise the model cannot make predictions.
Step-6: Click
Selectand choose the right learning or test data file(s) that match the corresponding labels. Make sure to match files with the correct corresponding labels.Step-7: Select the correct
Delimiterfor test files.Step-8: Click
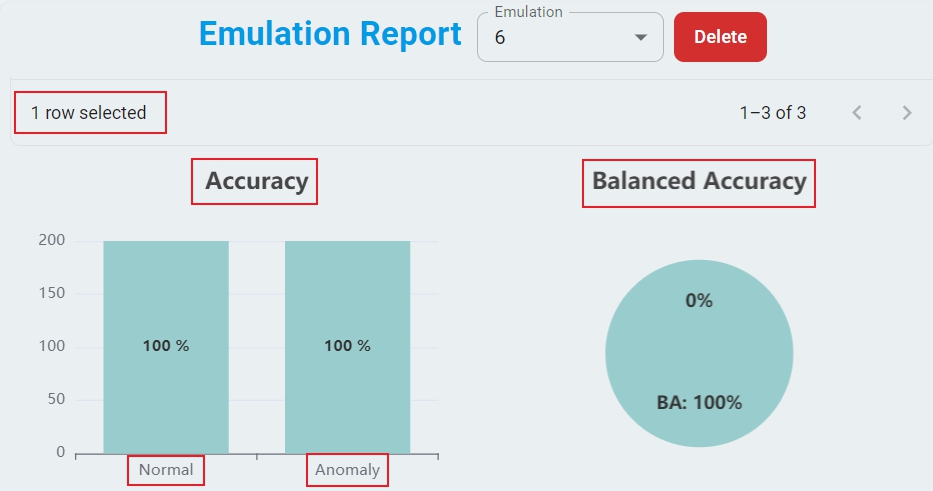
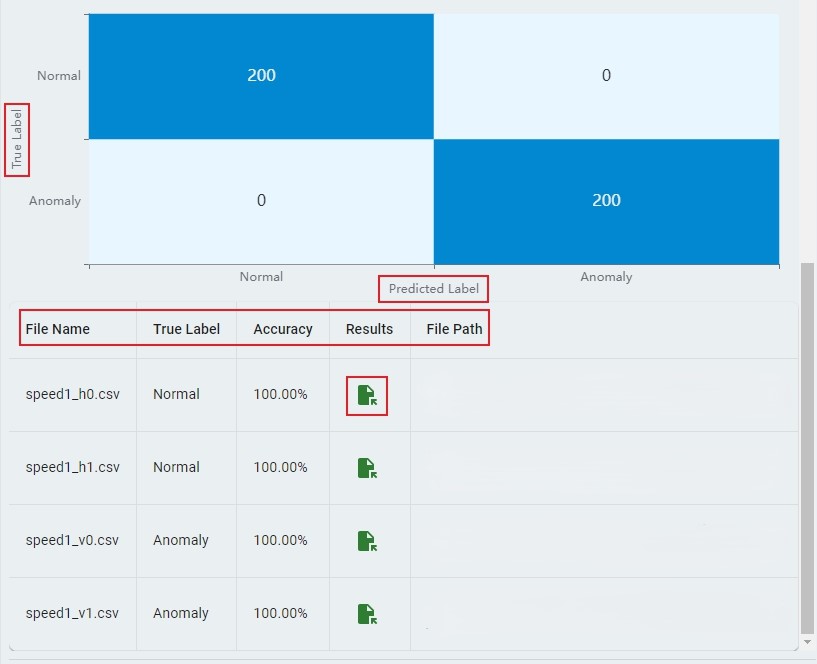
Start, and the backend server starts checking the test data files. The download of the emulation executable images starts and the emulation generates the test results. The process takes time, depending on your network speed and model complexity. Cancel at any time during this process if needed.Step-9: Upon completion, a comprehensive emulation report appears. The report includes the total accuracy and emulation status of each model. The report also includes the graphical displays of benchmark, the confusion matrix, and the test accuracy of each file.
Step-10: The test results are saved in CSV file format and can be found by clicking the
Fileicon in theResultscolumn.Step-11: If a model fails to emulate, click the
Failedicon of the model in theStatuscolumn to retry emulation for that model.Step-12: To analyze specific results, select the model you want to examine. The Anomaly Detection, Classification, and Regression models display different types of results.
Important: File paths must contain only English letters and standard characters. Avoid special characters and non-English characters to prevent file reading errors.
Emulation Reports Management
Each emulation execution generates a unique report that is saved in the database for future reference and can be managed through the following methods:
How to select an emulation report? — Choose the desired
EmulationId from the drop-down list.How to delete an emulation report? — Click the button
Delete.How to download a specific emulation report for each model? — Click the
Fileicon in the model’sReportcolumn to generate a downloadable report file. ClickDownloadand save the report to aPDFfile in the specified path.
Function layout of emulation model prediction
Here is the layout of Emulation Model Prediction for Data without Label, with the steps highlighted on how to run it.
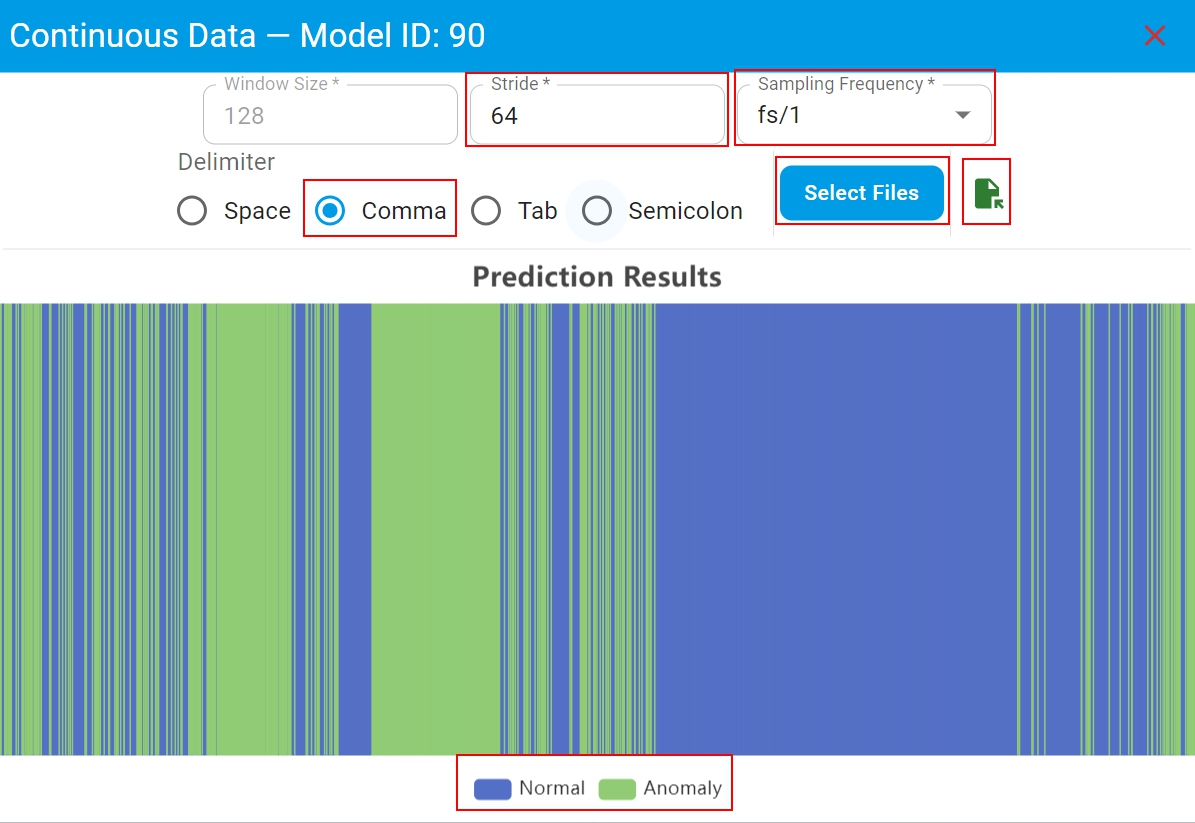
Here is the layout of the prediction results of continuous data with the key sections highlighted.
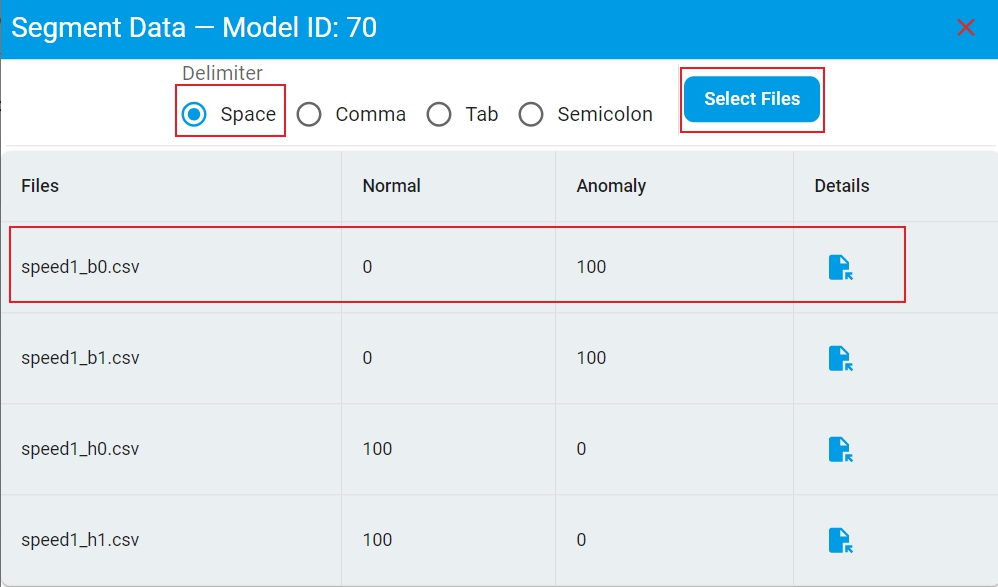
Here is the layout of the prediction results of segmented data with the key sections highlighted.
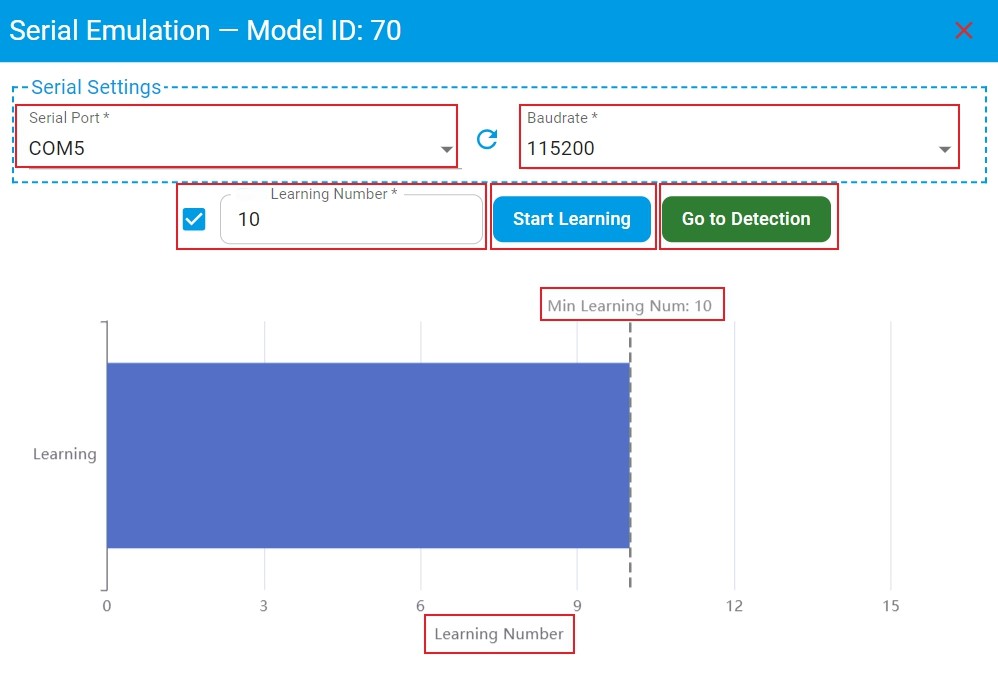
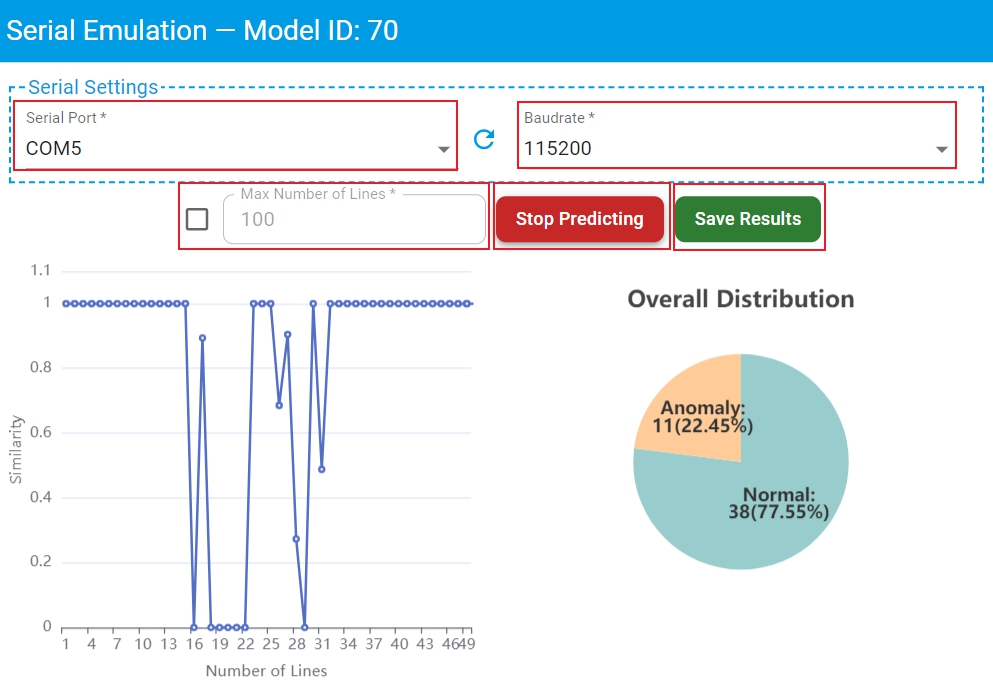
Here is the layout of the prediction results of serial port data with the key sections highlighted.
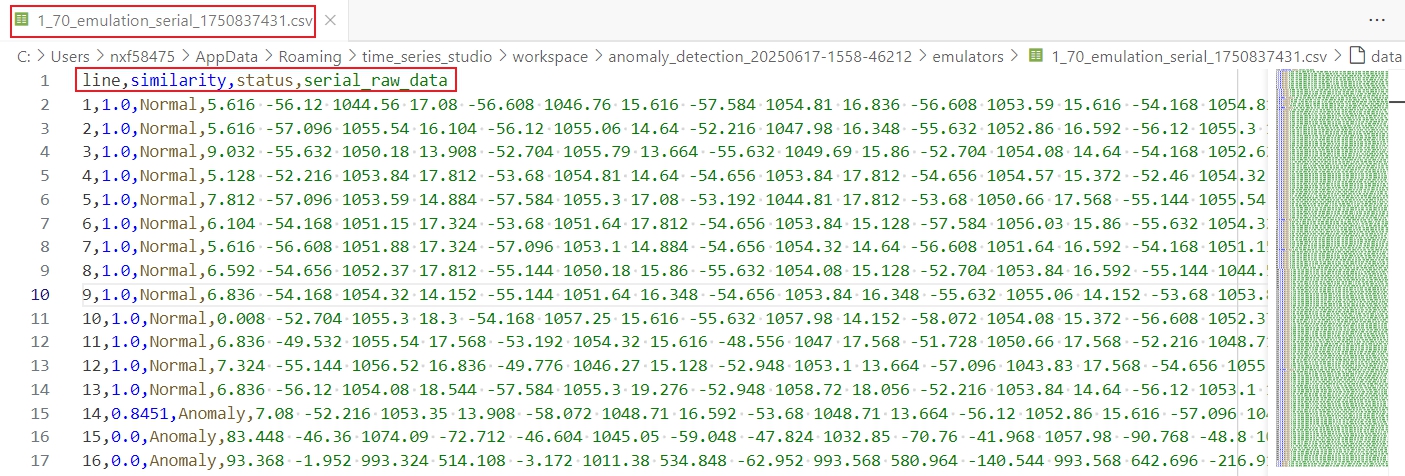
Here is the prediction result file saved in the workspace.
Emulation Model Prediction Process
Emulation requires public network support because the emulation executable image must be dynamically generated from the cloud server. Perform the following main actions.
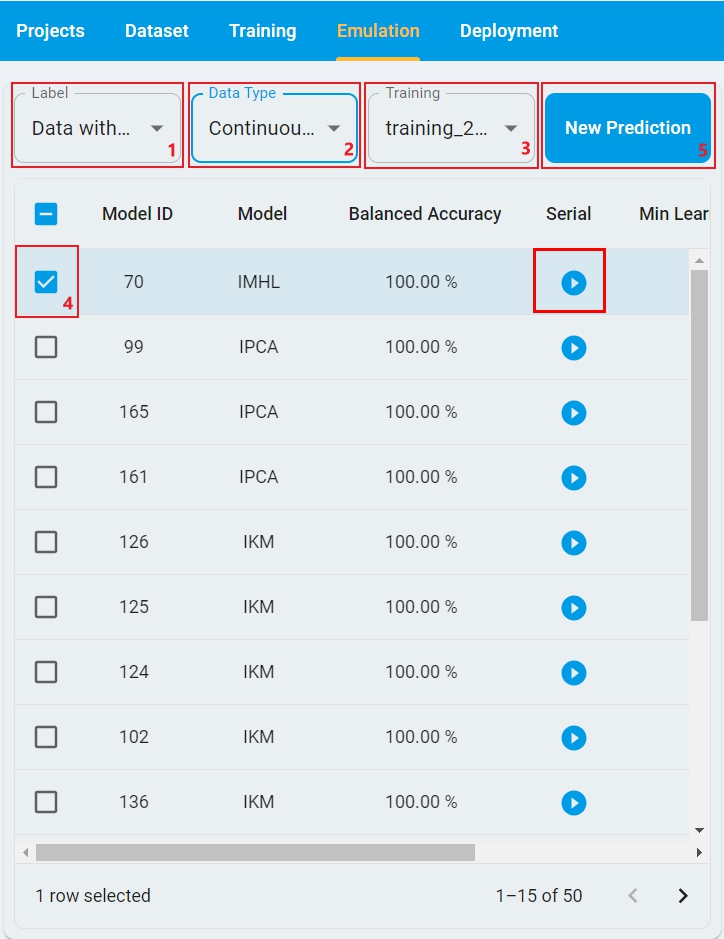
Step-1: Select
Labelstatus based on whether the test dataset is labeled. Here isData without Label.Step-2: Select
Data Typebased on whether the test data is continuous or segmented.Step-3: Select the
Trainingrecord from the drop-down list, which generated a lot of models by the training session.Step-4: Select the checkbox for the model to be tested.
Step-5: Click
New Predictionand open the test data files selection window.Step-6: Different
Data Typerequire different test file input configurations and display different prediction result report.Continuous Datarequires to setStride,Sampling FrequencyandDelimiter. Make sure that these parameters are consistent with the model training data. Then clickSelect Filesand choose a test data file. Once the emulation completes, the complete emulation report appears. The emulation report includes the distribution of prediction results for continuous data in the test file. The prediction result file is also saved in the workspace and can be found by clicking theFileicon.Segmented Datarequires to setDelimiter, then clickSelect Filesand choose one or more test data files. Once the emulation completes, the complete emulation report appears. The emulation report includes the distribution of prediction results for each test file. The prediction result file is also saved in the workspace and can be found by clicking theFileicon in theDetailscolumn.
Step-7: If you want to test real-time data from serial port, click the
Playicon in theSerialcolumn of the model selection list and open theSerial Emulationwindow.Select the correct
Serial PortandBaudrateto connect to the target board. Make sure that the data format output by the serial port is consistent with the model training data.Set
Learning Numberand clickStart Learningto perform on-device learning for anomaly detection model with on-device learning enabled. If the checkbox in front ofLearning Numberis checked, theLearning Numbercan be customized which default isMin Learning Numrecommended by the algorithm. Then on-device learning stops automatically when theLearning Numberreaches the set value. If this checkbox is not checked, there is no limit on theLearning Number, and must manually clickStop Learningto stop on-device learning. WhenLearning Numberis enough, clickGo to Detectionto test the performance of the model.Set
Max Number of Linesof serial port data and clickStart Predictingfor model prediction. If the checkbox in front ofMax Number of Linesis checked, theMax Number of Linescan be customized which default is100. Then model prediction automatically stops when theNumber of LinesreachesMax Number of Lines. If this checkbox is not checked, there is no limit on theMax Number of Lines, and must manually clickStop Predictingto stop model prediction. During the detection process, the prediction results of serial port data are graphically displayed in real time.Click
Save Resultsto get the prediction result file in csv format.
Important: Use only English letters in the test file path. To prevent file reading errors, avoid special characters and other languages.
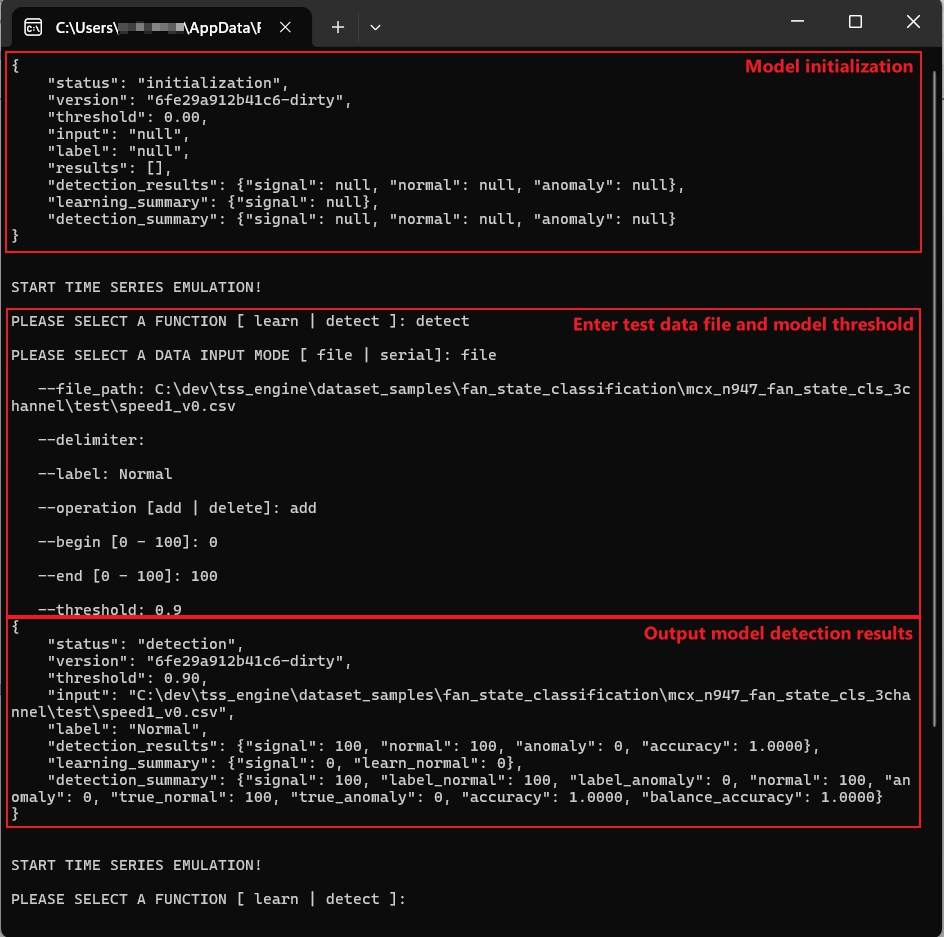
Emulation command-line execution
eIQ Time series studio emulation also supports command-line execution. If you want to test the model directly without the IDE, you can use it.
When you start an emulation in the page, the zip archive of the emulation executable image of each selected model is downloaded to the workspace/{project_name}/emulators/ directory.
The zip archive of the emulation executable image is named as {training_id}_{model_id}, which includes two files as follows:
TSS_Emulator — Emulation executable image of model.
algorithm.dat — Model compressed file.
metadata.json — Model metadata, including model information, benchmark results, and other details.
To start the model emulation, run TSS_Emulator in the terminal. After the model is initialized, enter your test data file information and some model parameters. Finally, the results of the test file appear as the output.
The details are shown in the following figure:
When is the emulation report reasonable enough to deploy?
Compare training and emulation benchmark results to decide if we must go back for:
Data recollection and washing?
Redefine the suitable algorithm task for the target application?
Readjust the training configuration and retrain for a better accuracy?
An emulation report is considered suitable for deployment when it meets the following criteria:
Training accuracy overall matches with emulation accuracy.
The accuracy results meet application expectations.
The confusion matrix error distribution matches with emulation accuracy for each class.
No obvious accuracy imbalance for all classes.