Time Series Data
Time series datasets are different from vision and voice datasets. Vision data is provided with one or three channels as a frame of fixed width and height. Voice data always maintains one channel with microphone waveform input.
Time series data comes from one or multiple sensors. Therefore, the number of channels varies and the algorithm design is different from vision and voice AI/ML applications. For example:
Raw sensor data can have different sample rates. How do you choose the best sample rate?
Raw sensor data output is time-sequential and continuous. How do you best segment the continuous data into framed data?
Multiple sensors generate heterogeneous datasets, which are not expected by machine learning algorithms.
Vision and voice data are human-readable, while time series data are unreadable with all floating-point format.
To illustrate time series data, let’s start with a data sample from a 3-axis accelerometer:
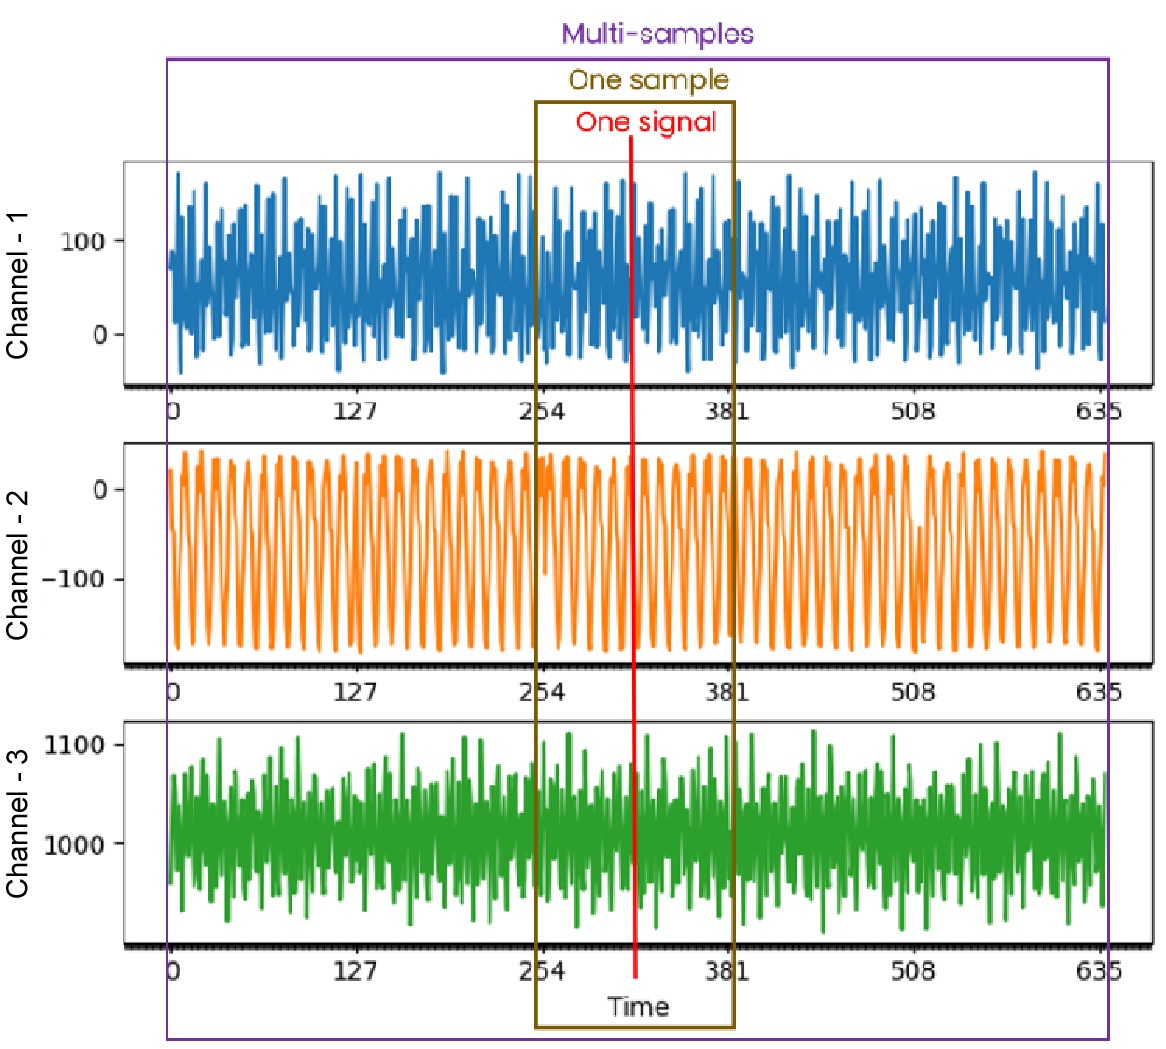
We can derive some basic concepts from the chart:
Each channel from the same sensor runs at the same sample rate, so the data scale for all channels is the same.
The sensor has three channels named C1, C2, C3 axis; most sensors have only one channel.
One sample point contains one data point for each channel consisting of C1, C2, C3.
One sample time window contains multiple sample points in time-sequential order: C1 C2 C3 C1 C2 C3…C1 C2 C3.
The entire dataset consists of multiple samples in random order.
For time series machine learning algorithms, the input data must always be based on a fixed time window frame. The output can be anomaly prediction, classified category, or a continuous value for regression.
Continuous Data
Hardware sensors always output raw data in continuous format by time sequence, as shown in the chart below:
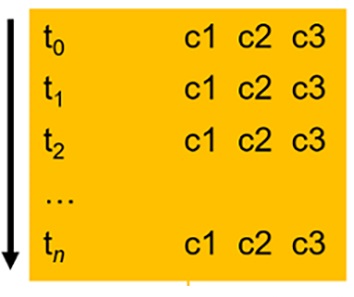
NXP recommends that customers save the continuous raw data in the format above and ensure that each line represents a time increment with channel(1), channel(2), channel(3), …, channel(n). Using a space as a delimiter is recommended. The first column is virtual and represents a timestamp T(n). It is used sequentially based on the timestamp when loading data line by line. Do not include a separate column as a real timestamp record. The Data Intelligence tool processes the continuous data file format for smart analysis and can save it as segmented data for further training.
Segmented Data
Segmented data can be imported for training and testing. Users can collect data themselves or use eIQ Time Series Studio to perform auto-segmentation. Here is a chart explaining the format of segmented data.
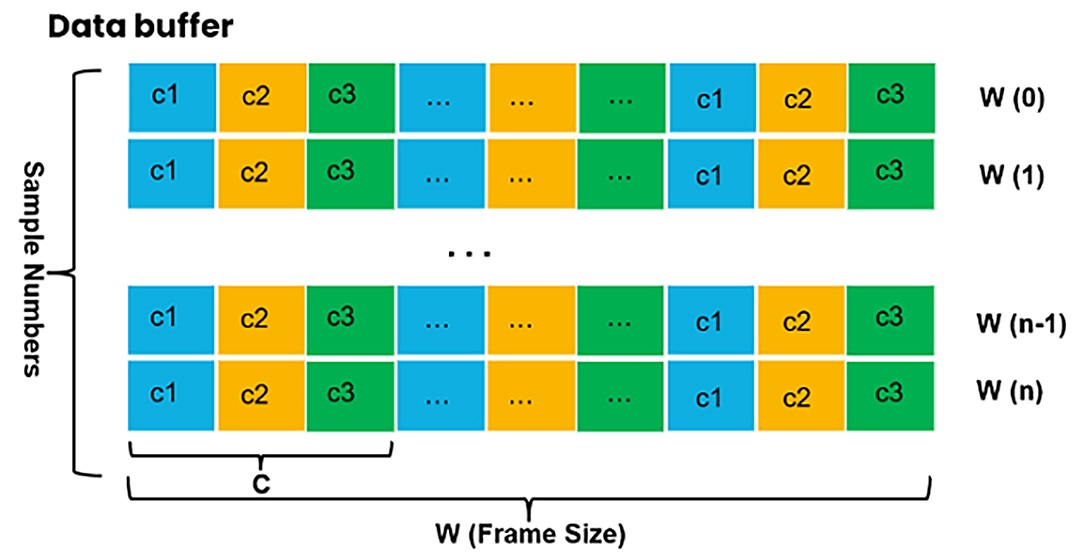
For segmented data:
Each line represents one sample with time-sequential data ordered by channels and can be used for training and emulation.
Multiple samples ordered line by line constitute a training dataset for algorithm research.
The line-by-line segmented data samples can be in random order, but each sample must maintain time-sequential order internally.
Multiple data files can be selected as one type to import for training and testing, and the data loader merges them automatically.
eIQ Time Series Studio Data Format
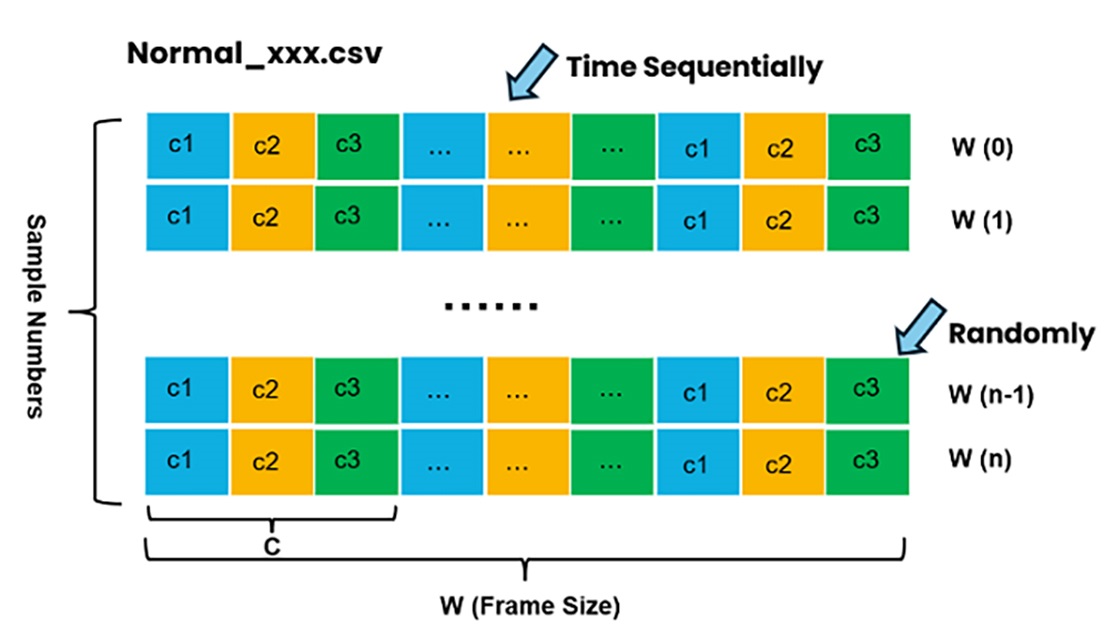
eIQ Time Series Studio only supports segmented data for direct import for training and testing. For different training tasks, follow the guidelines below to import proper sample format files.
Anomaly Detection
Anomaly detection requires importing both normal and anomaly sample data files. There is no need to keep data balanced between normal and anomaly types. You can import multiple types for both normal and anomaly categories. However, it is recommended to keep the dataset consistent to help the algorithm search produce solid results.
Normal Data Format
Anomaly Data Format
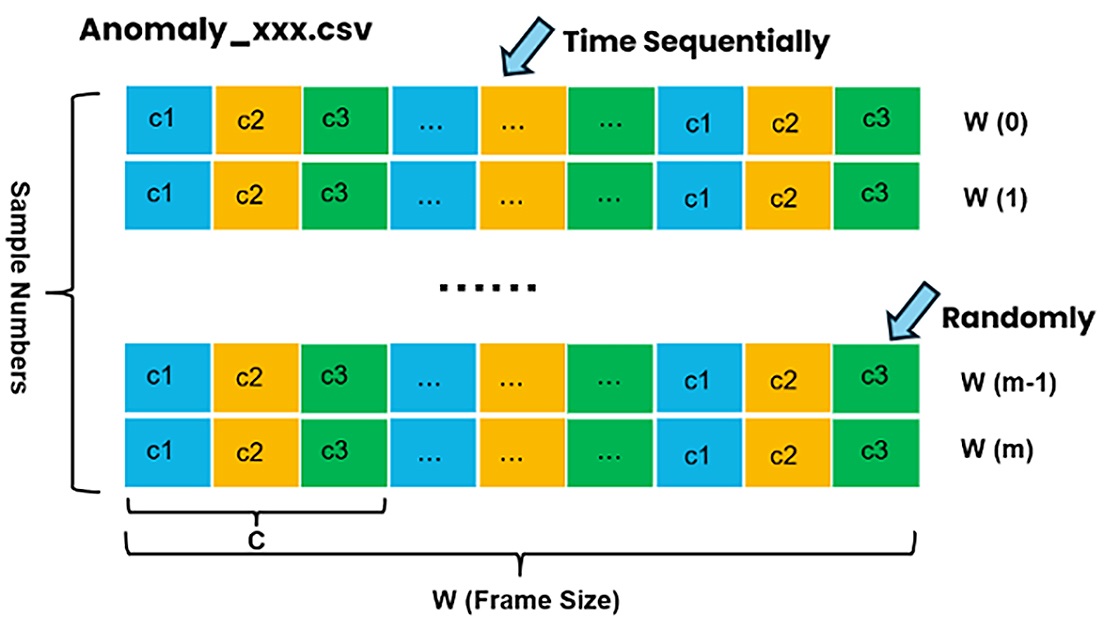
The anomaly detection dataset must specify the following:
Number of channels.
Normal data samples of multiple types and multiple files.
Anomaly data samples of multiple types and multiple files.
Note:
You can select multiple classes of datasets as normal or anomaly samples for training based on your real application. Change and try different categories to find the best accuracy and suitable algorithm.
n-Class Classification
n-Class Classification requires different labeled class sample data files to be imported. It is better to keep sample numbers for each class overall balanced for trustworthy training results.
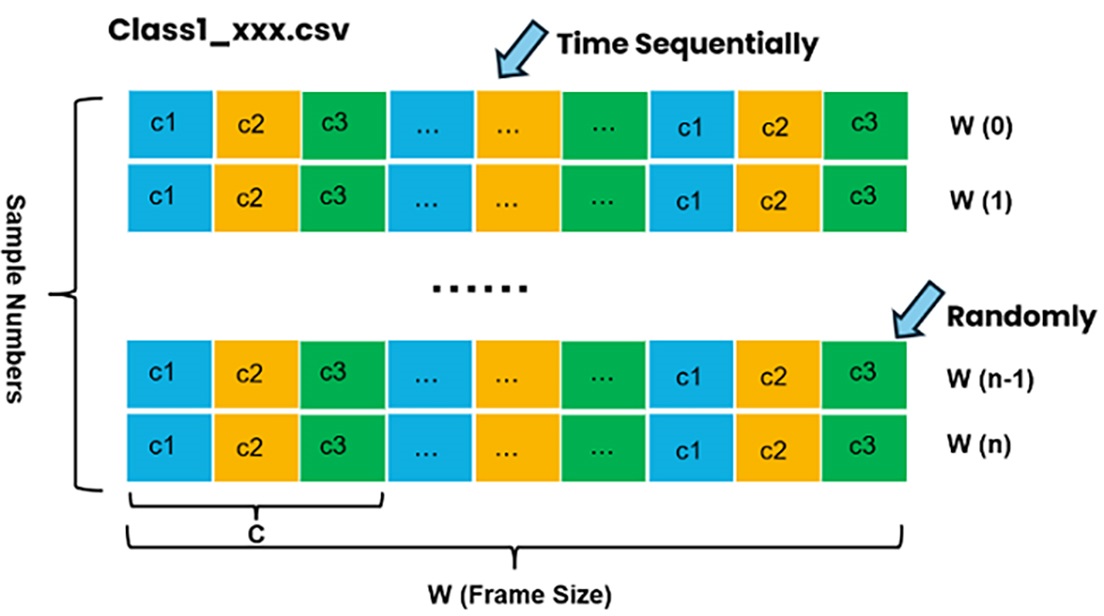
Class-1 Data Format
Class-2 Data Format
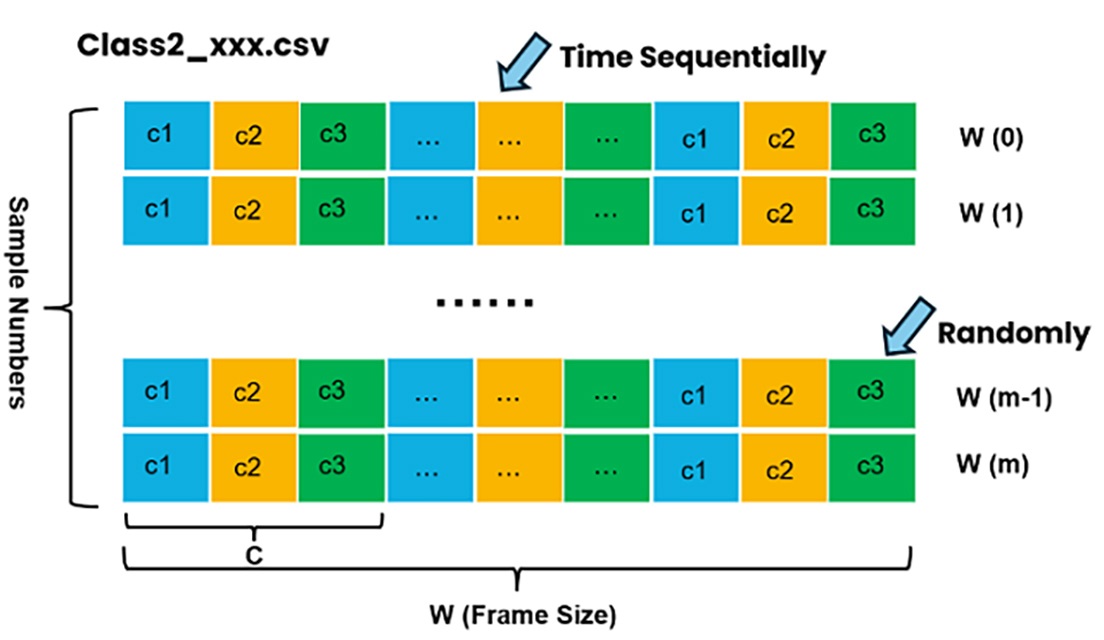
The n-class classification dataset must specify the following:
Number of channels.
Number of classes.
Data samples for each class. Each class must import data samples of only one type, but there can be multiple files of the same class type.
1-Class Classification
As a special case of n-Class Classification, 1-Class Classification requires a single class dataset. The format is exactly the same as n-Class Classification, but only one class of data is imported.
Regression
Regression requires labeled target sample data files to be imported. It is better to load as many balanced labeled samples as possible for training.
Regression Data Format
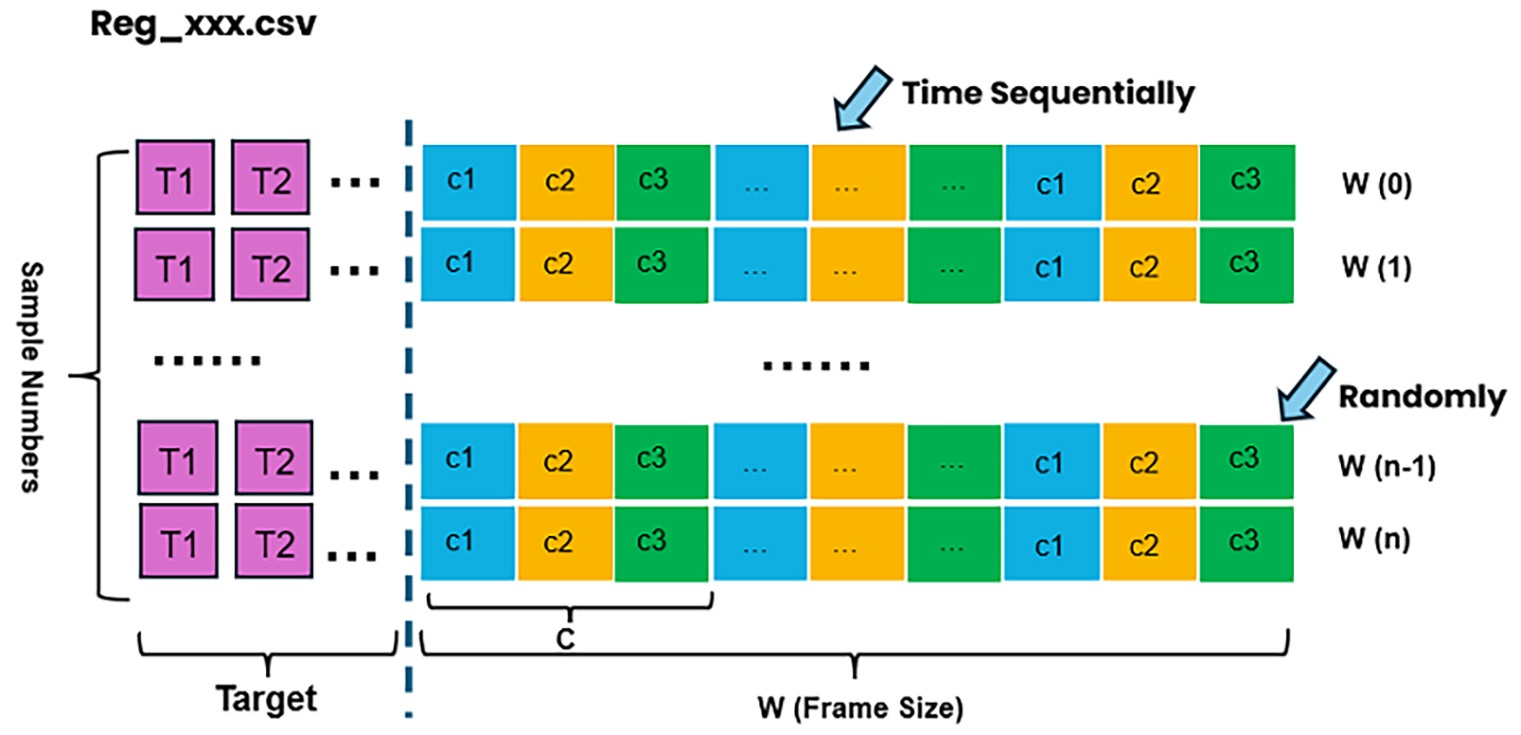
The regression dataset must specify the following:
Number of channels.
Number of targets.
Data samples, which can be multiple files with each line containing “targets + channel-ordered sequential data”.
Data Format Conversion
Based on the description above for the data sample formats for anomaly detection, classification, and regression, you can manually change the data sample format to adapt to different task changes. Here is an example of data format conversion from classification to regression:
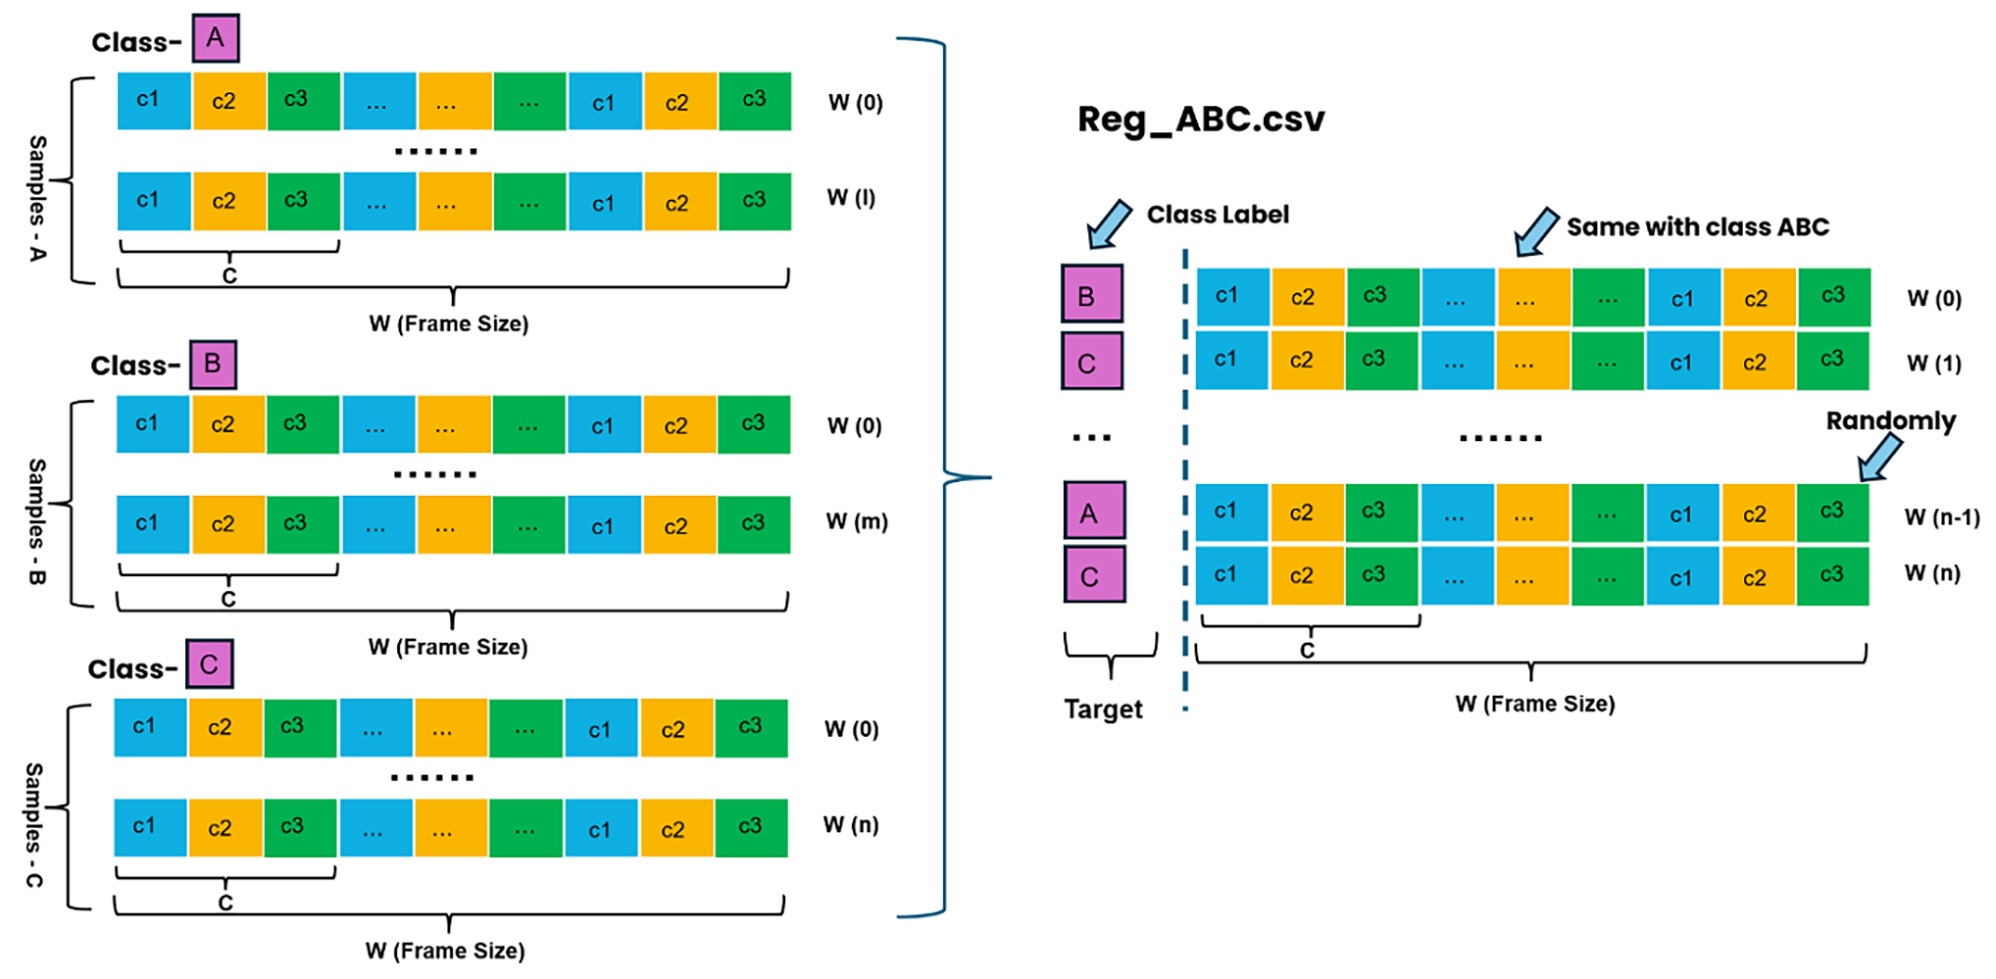
Main steps:
Use different classes as target labels.
Add the first column as a target and append a specific class of time-sequential data on the same line.
Make the regression data samples randomly ordered and save them for the regression training task.
Notes:
Currently, there is support for single-class classification only. Converting from classification to regression data format is relatively straightforward. Also, converting from single-target regression data samples to classification is possible. However, you must ensure that the converted labeled classification files are balanced in terms of data samples.